
General
Bitcoin Technical Analysis: BTC Grinds Near $59,000 as $58,000 Support Faces Critical Test
Bitcoin Technical Analysis: BTC Grinds Near $59,000 as $58,000 Support Faces Critical Test
By USA Crypto Group
Bitcoin Technical Analysis: BTC Grinds Near $59,000 as $58,000 Support Faces Critical Test
USA Crypto Group Desk| June 26, 2026
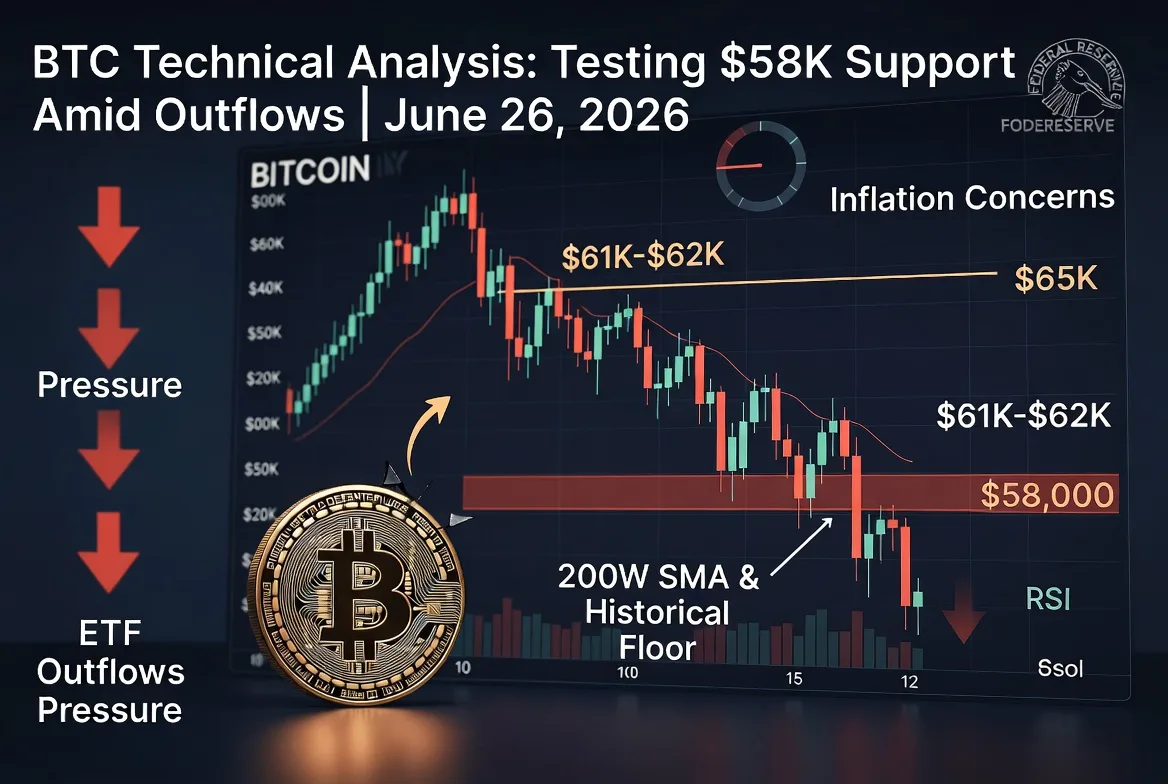
Bitcoin is trading in the $59,000–$60,000 zone on Friday, having slipped to multi-year lows near $58,000–$59,000 amid sustained selling pressure. The asset has corrected more than 50% from its October 2025 all-time high above $126,000 and is on track for a negative first-half close.
Price Action and Market Structure
On the daily and weekly timeframes, BTC has broken below key prior support zones ($70,000–$76,000), which have now flipped into resistance. The structure shows a clear sequence of lower highs and lower lows since the post-halving peak.
Immediate resistance: $61,000–$62,000 (recent swing highs), followed by $65,000 and the $70,000 psychological level.
Key support: $58,000–$59,000 zone. This area aligns with historical cycle floors, the approximate 200-week simple moving average, and is the level heavily watched by prediction markets and analysts. A daily close below it on volume would open the path toward $55,000 and potentially deeper cycle lows.
Broader context: Price has spent much of June consolidating or grinding lower after failing to hold higher supports. Volume has expanded on down days, consistent with distribution rather than accumulation.
Short-term (4-hour) charts show choppy action with repeated tests of the lower boundary. Any sustained bounce would first need to reclaim $61,000–$62,000 to shift momentum.
Technical Indicators
Most standard indicators remain bearish or neutral-oversold:
Moving Averages: Price sits below the majority of key MAs (50-day, 200-day, and shorter-term EMAs). The 200-week SMA near $58,000 continues to act as a major dynamic floor historically.
RSI (14): Previously reached deeply oversold readings (near 17 in early June). While this can precede reversals, momentum has not yet confirmed a bullish divergence on higher timeframes.
MACD: Remains negative with bearish histogram and signal line positioning, reflecting persistent downside momentum.
Bollinger Bands & Volatility: Price has interacted with the lower band during the June decline. Band expansion on down moves signals elevated volatility and trend continuation risk.
Volume Profile: Higher volume nodes from earlier in the year sit well above current prices, leaving thin support until the $58,000–$60,000 cluster.
On-chain metrics reinforce the picture: a historically large share of supply remains in loss, indicating widespread capitulation but also potential for absorption if long-term holders continue buying dips.
Derivatives Market Snapshot
Funding rates and open interest patterns have generally favored downside positioning in recent sessions. Large options expiries and put-heavy skew have added to pinning or bearish pressure near current levels. A shift to positive funding and rising long OI would be an early sign of stabilization.
What Is Moving the Crypto Market
Several interconnected forces are driving the current environment:
1. Spot Bitcoin ETF Flows
Persistent outflows remain the dominant near-term pressure. Recent sessions have seen daily redemptions in the hundreds of millions, with BlackRock’s IBIT leading outflows on multiple days. A multi-week streak earlier in June exceeded $4 billion in withdrawals before a brief pause; flows have since turned negative again. These redemptions translate directly into selling pressure as authorized participants return Bitcoin to the market.
2. Federal Reserve Policy and Macro Data
Hawkish Fed rhetoric and sticky inflation have delayed rate-cut expectations. Markets are repricing a higher-for-longer environment, which weighs on risk assets including Bitcoin. Geopolitical tensions (notably oil price impacts) have added an inflation premium, keeping the central bank on hold. Bitcoin’s correlation with traditional risk assets remains intact.
3. Institutional and Large-Holder Dynamics
Strategy (formerly MicroStrategy) holds a massive Bitcoin position that is significantly underwater. Any dividend-related activity or perceived selling adds supply overhang. Whale distribution has also been noted in recent weeks.
4. Broader Risk Sentiment and Cycle Positioning
Risk-off flows have hit equities and crypto alike. Within crypto, Bitcoin dominance typically rises in such environments as altcoins underperform. The post-halving cycle narrative is being tested: some view the current capitulation as a generational bottom setup, while others warn of further downside toward $50,000 or below if macro conditions deteriorate.
What to Watch Next
$58,000–$59,000 zone: Daily close and volume reaction will determine whether this holds as a floor or breaks into acceleration lower.
ETF flow prints: Any multi-day return to net inflows would be the clearest signal of institutional stabilization.
Macro data & Fed speakers: Inflation prints, jobs data, or comments from officials before month-end carry outsized weight.
Strategy updates: Any movement around the June 30 dividend reset could influence sentiment.
On-chain absorption: Rising exchange outflows or long-term holder accumulation at these levels would support a bottoming thesis.
The technical structure is fragile. Bitcoin is defending a historically important support zone while facing ongoing ETF redemption pressure and macro headwinds. Traders should size positions conservatively and monitor the $58,000 level closely for confirmation of either a relief rally or deeper correction. Inflows returning in size or a dovish Fed shift would be required to alter the near-term bearish bias.
USA Crypto Group